Progress bar infographics in After Effects can be a very interesting way and basically can unfold some fundamental thoughts regardless of infographics in general. The progress bar infographics are quite simple as a process inside After Effects.
Infographics are a really powerful way to transmit another way boring information. Infographics make the whole experience much more appealing to the receiver. No wonder nowadays has been used around the globe so much.
We are going to create a progress bar using a simple infographic element technique inside After Effects. In the next post, after we create a single progress bar (this article) we are going to create a presentation of progress bar infographics.
Feel free to take a look at a previous post about how to make a simple count number infographic in After Effects.
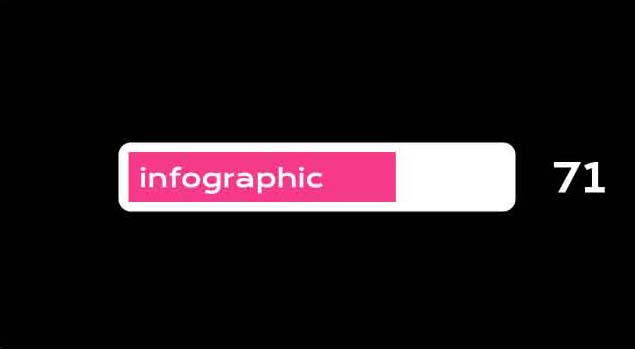
We are going to create the following infographic animation:
In case you are more like a video learner you can watch the video below, which is basically in a lite way the same thing. Keep in mind, that in the video the approach is more like how we do it and less about why we do it:
That has been said, let’s get started.
Creation of progress bar infographics in After Effects:
Step 1 (new composition):
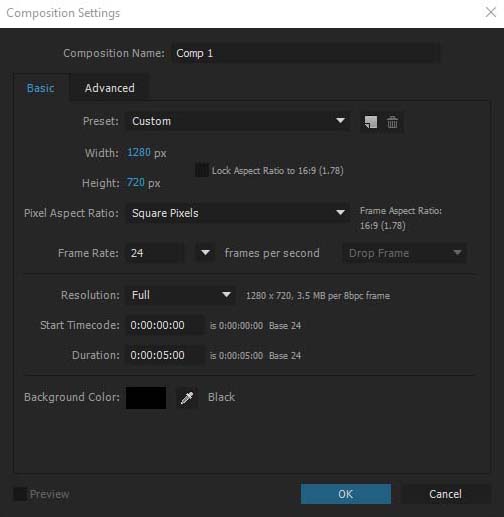
Open After Effects and create a brand new project and create a new composition by going to composition – new composition (shortcut: ctrl + N). I have set mine in an HD aspect ratio (width 1280 x height 720), 24 FPS (frame per second) and I make the duration around 3 seconds long. Last but not least, I have renamed it something like “progress bar comp 1”.
Step 2 (add the border of progress bar):
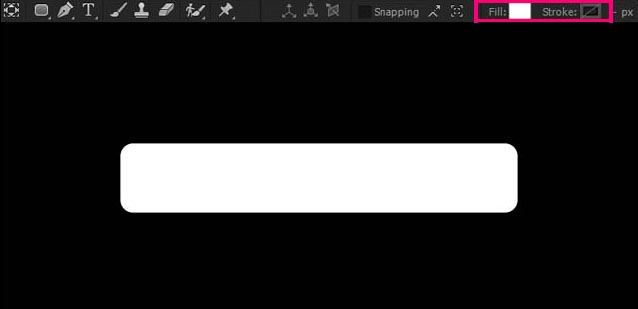
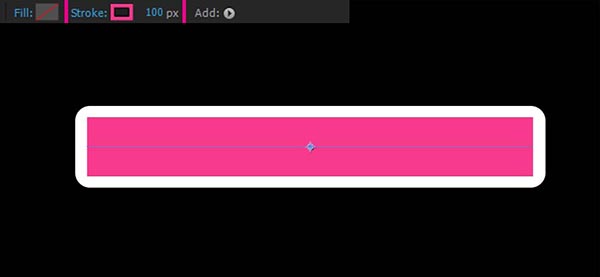
Select the rounded rectangle tool (Q) and try to create a simple rectangle like the image below. Set the fill color to white and remove the stroke color. Also, align it to the center of your composition. I rename the shape layer to “border of progress bar”
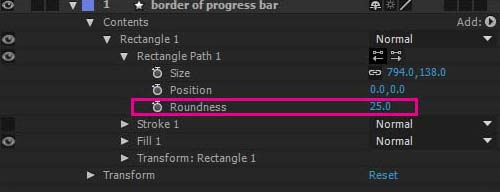
Note: If you want to change the roundness of the rectangle you just created, you can do that by expanding the shape layer contents – rectangle – rectangle path. In that section, there is the Roundness option for you to adjust.
Step 3 (making the progress bar element):
Now it’s time to create the progress bar infographic element.
Select the pen tool (G) and try to create a simple line inside the rectangle border which we created in the preview step. Try to be aligned it with your rectangle border. In order to create a line, you probably figured you have to make two clicks. One for the start of our line and one for the end of it. Give some thickness for our line around 100px and make it vivid pink, or any other color you prefer. Rename that new shape layer to “progress bar”.
Note: For a perfectly straight line, you have to hold shift when you make the second click (end of the line).
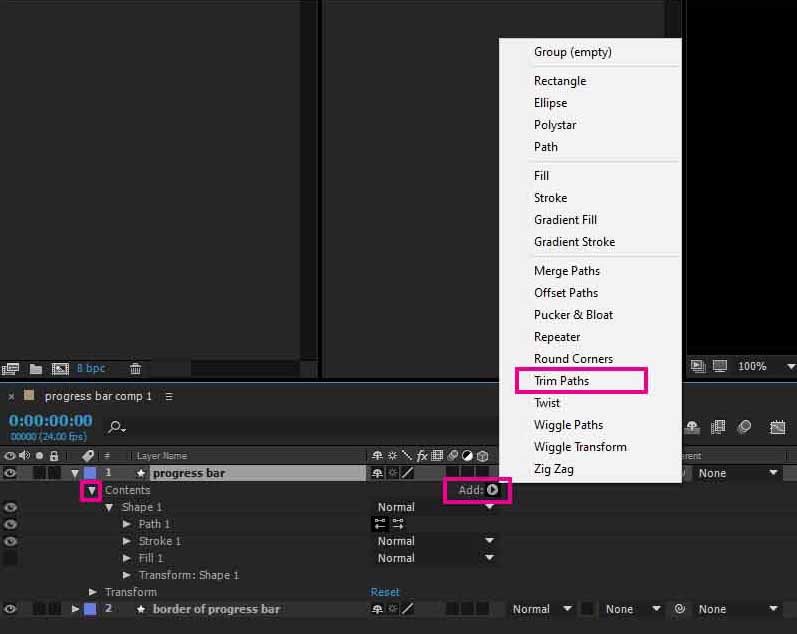
Select the progress bar layer you just created and expand its properties. There is an add button beside the contents. Click on it and select from the popup window the trim paths. There has been created a new function that will allow us to trim our path (progress bar).
We are not going to do anything with it yet. We will leave it as it is and move on.
One way for controlling infographic elements, in general, could be to manually adjust their values. Another and better way to control infographic elements is by automation.
For example, in our project, the goal is to have a progress bar and a percentage number. And we want them to be connecting. When we alter the percentage number we want that to have an automatic impact on the length of our progress bar. In other words, we will control the behavior of multiplay elements at once.
The way to do that is with a slider control expression on a null object. But first, let’s create the percentage number – text element.
Step 4 (create the percentage number element):
Select the type tool (ctrl + T) and just click once in your After Effects canva, anywhere it doesn’t matter, to close the command click anywhere in your layer area. Also, don’t type anything at all.
We are not going to do anything with it just yet. In the next step, when we will create the null object, we will connect them together.
Step 5 (make the null object):
The null object we will create right now will be our controller to control both the progress bar (step 3) and text element (step 4) simultaneously. And as we already said, we will do that with a slider control expression. But don’t be alarmed. We will write by ourselves only two words.
Go to Layer – new – null object. A null object has been created and centered in our canva of After Effects. There is no need to move it or do anything with it. Just rename it “infographic controller”.
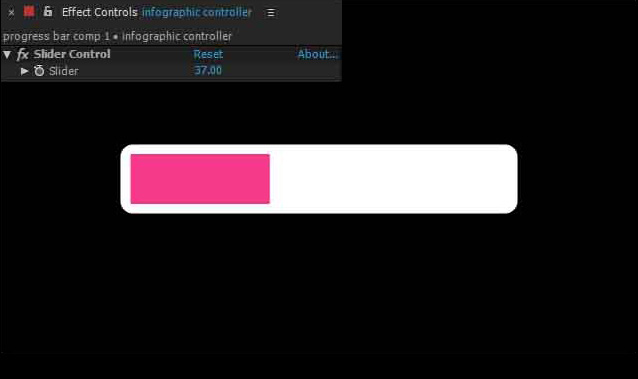
Now, we want to add a slider control effect on the null object we just created. So select the infographic controller (null object) and go to Effects & Presets and type slider. Under Expression controls, you can locate the specific effect. Double-click or just drag and drop it into your null layer.
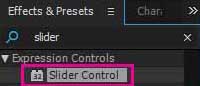
The slider control effect has only one parament, as the name suggests a slider parament.
Step 6 (create all connections of our infographics):
The goal here is to hook up both the progress bar and percentage number-specific paraments on those layers into that slider. So, when we move the slider it will have an equal effect on both layers simultaneously.
Progress bar connection:
At this point, we have four-layer in our composition. Expand the progress bar layer until you find the trim paths 1 section and expand it as well. There is an End attribute. Alt + Left-click on it and the percentage will turn red, which is an indicator you are in expression mode. Don’t write anything, just click and drag a connection from the little symbol which looks like this one “@” to the slider control in our null object. To do that you have first to select the infographic controller (null object) and then as the progress bar has already been expanded make the connection between them.
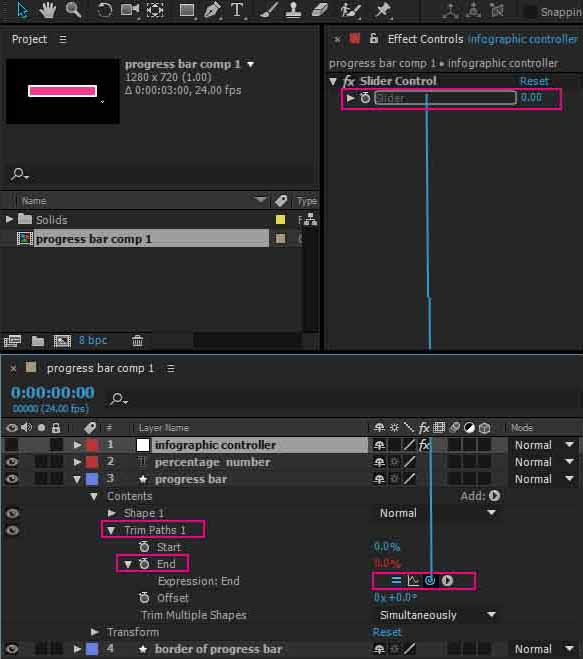
After that, a connection has been established. To verify the connection select the infographic controller and play with its slider control, to see the results.
Percentage number connection:
Now we have one connection established (progress bar), it’s time to connect the other one, which is the percentage number.
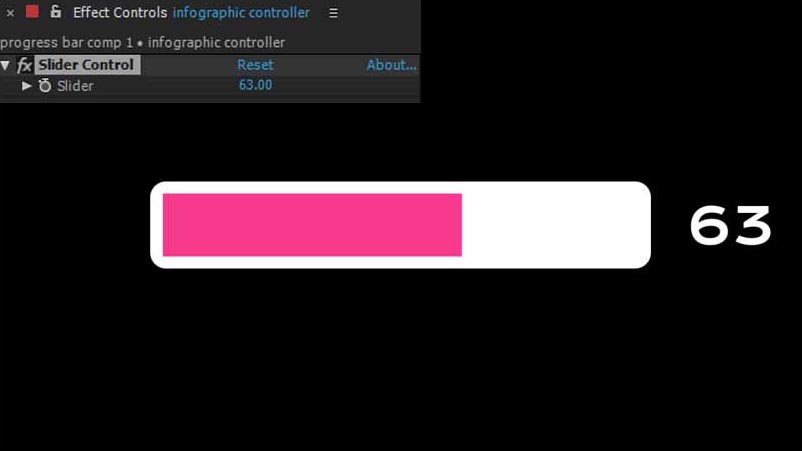
This time expand the percentage number layer until you find the text section and expand it as well. There is a source text attribute. Alt + Left-click on it like we did with the progress bar above. The expression icons appear once again under the source text attribute. Select the infographic controller and again make the connection with the help of the “@” icon from the source text parament to the slider control of the infographic controller layer.
After that, the second connection has been established as well. Both infographic elements (progress bar and percentage number) are connected to the slider control. To verify it, select the infographic controller and play with the slider to see the results.
Step 7 (create a simple text inside the progress bar):
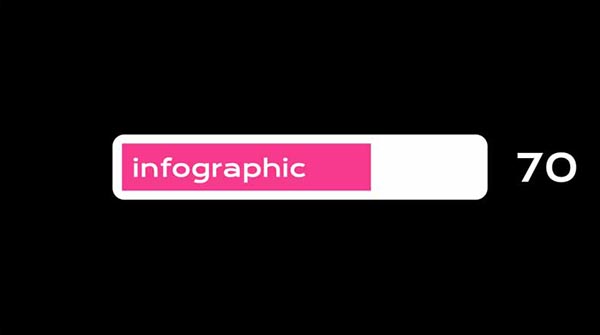
We want to add some simple text inside the progress bar to determine the concept of this specific progress bar. The idea behind it is when the length of the progress bar moves to the right the text which shows up gradually.
To achieve it, we are going to cheat a little. What I mean! Since we have created a border for the progress bar in step 2 which happens to be a white one, we are going to use white text as well. As a result, our new simple text won’t be visible since both the text and border will be the same color, right! And as the progress bar length moves to the right, then and only then our new text will gradually appear. Let’s create it.
Select the type tool (ctrl + T) and click and type infographic. Of course, you can type anything you want. Make the text white, and apply any font you like. Most importantly, position this new text inside our progress bar and to the left.
Step 8 (creating infographic animation):
Now we have created our infographic connections it’s time to animate them, right!
Select the infographic controller, go to frame 0 in your timeline, and add a key to the slider control of the infographic controller by pressing the stop-watch icon on the left of the slider attribute. A key was added. Go two seconds later and add another key to the slider control, this time make it like 71 value. Select both keys in your timeline and press F9 (Easy ease) for a smoother transition.
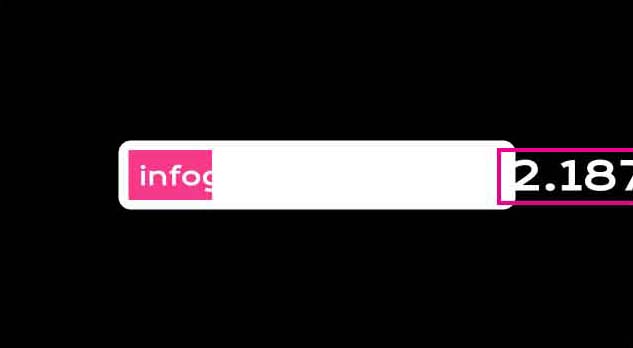
If you play the animation you will find out there is an issue that occurs in the percentage number element. You are going to address it right away.
Issue:
The percentage number it’s seems to be animating correctly, but there is a decimal point on it. The way to solve that issue is by adjusting the expression of the percentage number element itself.
Expand the percentage number layer until the source text section. At this point our expression for this attribute is like this:
thisComp.layer(“infographic controller”).effect(“Slider Control”)(“Slider”)
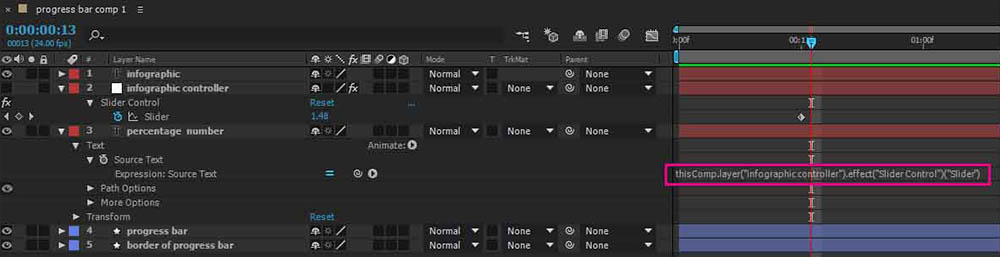
This expression was created when we simply connected this parament with the slider control (null object). The way to remove the decimal point you have to add a simple function at the start of this line of expression and add an extra parenthesis after the Math.round function and at the end of it as well. The function is Math.round. Is a function that makes a decimal point number to be a whole number.
Our new fixed expression would be:
Math.round(thisComp.layer(“infographic controller”).effect(“Slider Control”)(“Slider”))
As you can see, if you play the animation, the issue has been solved.
That was it, you made it.
Conclusion:
Creating a progress bar infographic in After Effects as you can see is not that hard, of course, if you have basic knowledge of After Effects.
Furthermore, in our example, we decided to use a slider control to control simultaneously both infographics elements we had (progress bar, percentage number) and not controlled both of them separately through a manual process. The reason behind it is time. In our example, we had only two infographic elements to be animated. But what if we had 5 or 10 elements! We would have to animate all those extra elements separately and synchronize them all together, which is some extra work on our part. Of course, in some cases, the end result could be to animate everything separately so we can have a variation.
In our example of creating the progress bar infographics in After Effects, we created a simple progress bar, which goes from left to right. In that matter, it could also go from down to up or any other way. We can make a presentation of a bunch of progress bar elements that show us a poll, statistics, etc.
You can find here a similar progress bar infographic on Youtube by Learnin5, which I found very easy to follow.


7 Responses
This is quality work regarding the topic! I guess I’ll have to bookmark this page. See my website 71N for content about Cosmetics and I hope it gets your seal of approval, too!
This is quality work regarding the topic! I guess I’ll have to bookmark this page. See my website 92N for content about Thai-Massage and I hope it gets your seal of approval, too!